



































































Are you looking to optimize your grow by giving every plant the perfect amount of light? Just install a PPFD measurement app to turn your smartphone into a precise measurement tool. That way, you can check whether your LED grow lights really deliver the illuminance they advertise. This guide covers the best Android and iOS apps, compares their performance, explains how to calibrate them, and gives you practical tips for a successful, hassle-free grow.
Best PPFD apps for Android and iOS
Choosing the right app can make the difference between rough estimates and usable data. We tested Photone, PPFD App, and other solutions that automatically convert lux into PPFD and DLI. These tools will help you fine-tune the height, intensity, and spread of your light. You'll also understand why accuracy varies depending on your smartphone's ambient light sensor, and when it's better to use an external lux meter for more reliable results.

Is Photone accurate enough on iPhone and Android
Photone is the most popular app for measuring PPFD thanks to its simple interface. Our tests on iOS show a deviation of under 5% compared to a professional device like the Apogee quantum meter. On Android, accuracy can vary by up to 30% without calibration depending on the phone model, but Photone remains more reliable than most alternatives.
- Custom profiles: choose between germination, vegetative stage, and flowering, then select your light type (LED, HPS, or LEC).
- Simple mapping: generate a PAR grid, export your data as PNG or CSV, and track your lighting over time.
- Bluetooth option: on Android, connect an external lux meter to get around the limits of the built-in sensor.
Once calibrated with the manufacturer's values, Photone becomes a handy tool for adjusting your light height and intensity. However, for contractual measurements, a professional device is still necessary.
Lux, PPFD, and DLI explained simply
Lux measures light as visible to the human eye, while PPFD counts only the photons useful for photosynthesis (between 400-700 nm). DLI adds up these photons over a full day to make sure each plant gets the ideal amount of light at every growth stage.
The same lux value can correspond to very different PPFD readings depending on the light spectrum. For example, 10 000 lux under a neutral white LED isn't equivalent to 10 000 lux under a red LED. Apps therefore use conversion coefficients based on spectral profiles. That's why calibrating against a reference PPFD meter is essential for reliable measurements.
When to prefer an external Bluetooth sensor
For maximum accuracy, pair your app with an external Bluetooth lux meter like the UNI-T UT383 BT. Our tests show that the deviation from a professional device drops from 33% to just 11% with this type of sensor, which avoids the limitations of your smartphone's built-in sensor.
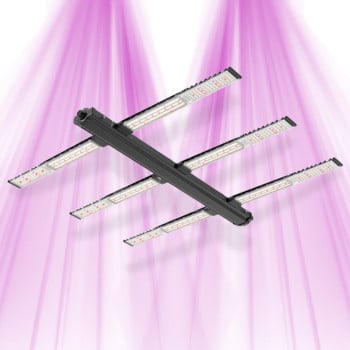
This type of sensor offers a more consistent spectral response, perfect for comparing different LED grow lights or fine-tuning your settings precisely. For example, this EVO 4-100 horticultural LED panel claims 696 µmol/s. With your PPFD measurement app, you can check this value and adjust your setup without investing in expensive equipment.
Calculation methods for ppfd and photone calibration
Getting accurate ppfd measurements requires a methodical approach and a good understanding of the limits of mobile sensors. Here, we'll guide you through all the key steps: taking measurements, calibrating apps like Photone or PPFD App, interpreting the results, and adjusting the height, intensity, or duration of your lighting. You'll also discover how to set up a measurement grid, convert instant readings into DLI, and use a few simple accessories for more reliable, repeatable measurements.

How to measure ppfd with a smartphone
Before starting your measurements with your ppfd meter, leave your LED grow light on for at least 10 minutes so the light output stabilizes and PWM flicker doesn't disrupt your readings. Then position your smartphone perfectly flat, sensor facing up, exactly at the height of the top of your plants. To avoid any interference, hold it firmly with both hands or use a stable mount, then start the measurement while making sure to eliminate any stray light source.
To assess how evenly light is spread, set up a measurement grid. Over a 1m x 1m area, take for example 25 readings spaced 20 cm apart, taking 2-3 measurements at each point. Then calculate the average, the extremes, and the uniformity (minimum ÷ average × 100%); a result above 70% is ideal to avoid over- or under-lit areas. This data will help you adjust the height, orientation, or number of lights before starting your grow. Don't forget to export the CSV data from Photone or PPFD App to track changes over time.
Photone and lux→ppfd conversion
Converting lux to ppfd requires a coefficient that varies depending on your LED light's spectrum. Photone offers several preset profiles (warm white, cool white, red-blue spectrum, HPS) that automatically apply the right conversion factor, since each type of light contains a different proportion of PAR photons useful to plants.
To improve Photone's accuracy, compare your data against a reliable reference: either a professional device like the Apogee SQ500, or the manufacturer's specifications. For example, a ZEUS PRO 1000W light with a PPF of 2925 µmol/s covering 2,25 m² should theoretically deliver around 1300 µmol·m⁻²·s⁻¹. If Photone shows 1100, apply a correction factor of about 1,18 in the app to get more realistic values.
Be careful: some spectra like the SANlight EVO include far-red at 730 nm, which isn't counted in ppfd, and this can skew conversions if the selected profile doesn't account for it. The ZEUS PRO spec sheet gives all the useful specifications; use this information to adjust your settings and avoid light stress or wasted energy.
Practical cases with Android and an external sensor
Android devices often show significant deviations due to how varied their sensors are. Our tests show that PPFD App can underestimate values by about 33% without calibration, while Photone shows an error margin of about -10%. Using it together with an external lux meter like the UNI-T UT383 BT reduces the deviation to about 11%, making it an appealing solution for more reliable measurements.
The following table summarizes the performance of different measurement configurations under horticultural LED lighting, helping you choose the solution best suited to your setup:
| Configuration | Average deviation vs Apogee SQ500 | Measured uniformity | Recommendation |
| iPhone + Photone | ≈ –3 % to –5 % | Very good (>80 %) | Excellent without an accessory |
| iPhone + PPFD App | ≈ –4 % to –6 % | Very good (>80 %) | Excellent, more features |
| Android + Photone only | ≈ –10 % | Good (~75 %) | Acceptable, calibrate if possible |
| Android + PPFD App only | ≈ –33 % | Variable | Calibration essential |
| Android + PPFD App + UNI-T BT | ≈ –11 % | Good (~75–80 %) | Best Android option |
Interpreting a PPFD table and optimizing lux
Once you've taken your light measurement, mastering how to interpret a PPFD table will let you precisely fine-tune the height, intensity, and duration of your lighting for every stage of growing. We'll explain how to connect lux, PPFD, and DLI to your LED settings, identify areas that are over- or under-lit, and then use this data to automate your setup. You'll discover that a well-used free app can radically optimize your growing space for every type of plant.
Photone, Android, and light uniformity
The uniformity of your light output is crucial but often overlooked: a high average isn't enough if the center gets 1200 µmol·m⁻²·s⁻¹ while the edges only get 400, because your plants at the edges will stagnate. To build a reliable PPFD table, map your space in a grid (for example 5 × 5) and calculate uniformity = (PPFD min / PPFD average) × 100%. Aim for at least 70-80% and adjust the height or orientation of your LEDs if needed.
- 5 × 5 mapping over 1m²: measure every 20 cm (corners, edges, center) and record the values; the Photone app on Android immediately generates a color map to visualize hot spots and weak spots.
- Optics adjustment: with a model like the SANlight EVO 4-100, tilt the reflectors up to 11° to better spread photons toward the edges without changing the height.
- Multiple units for larger areas: in a 120×120 cm space, two EVO 4-100 units deliver an average of about 966 µmol·m⁻²·s⁻¹ with 80% uniformity, compared to just 483 µmol·m⁻²·s⁻¹ for a single unit.
Systematically log your settings (height, intensity, power draw, PPFD) in a CSV file exportable from the app: this way you'll build up a valuable database to reproduce your best setups. This method also reveals any anomalies, such as LED aging, and turns your space into a genuine lab, even as a beginner.
Connecting lux, PPFD, and dimmer in practice
Understanding the link between lux, PPFD, and intensity will help you anticipate the impact on your plants. Take a 320 W LED bar (efficacy 2,7 µmol/J) covering 1m²: at full power and 50 cm high, you'll get several hundred µmol·m⁻²·s⁻¹. By reducing intensity to 50%, light output drops proportionally (≈ 432 µmol/s), ideal for the vegetative stage without CO₂.
Build your own curve by measuring PPFD at different intensities (25%, 50%, 75%, 100%) and heights (30 cm, 45 cm, 60 cm) with your measurement tool. This 320 W horticultural LED bar allows precise control via home automation. Program gradual changes (e.g., a gradual ramp-up over 30 min) and check that your values match your needs: 100-300 for germination, 300-600 for the vegetative stage, 600-1000+ for flowering (with CO₂). This approach avoids light stress and optimizes your yield.